
Exploring reports
Understanding your spending habits and areas using Ducat’s powerful reports.
The Reports page is one of the most actionable areas of the app.
This is where you can understand how you have been spending your money over the last week, last month, or any time range you wish to review.
Armed with this information, you can influence future spending to keep your finances aligned with your long-term goals.
At a glance
The Reports page highlights your spending trends using multiple indicators, such as a past and future balance trend, the highest spend category and your daily spending trend:
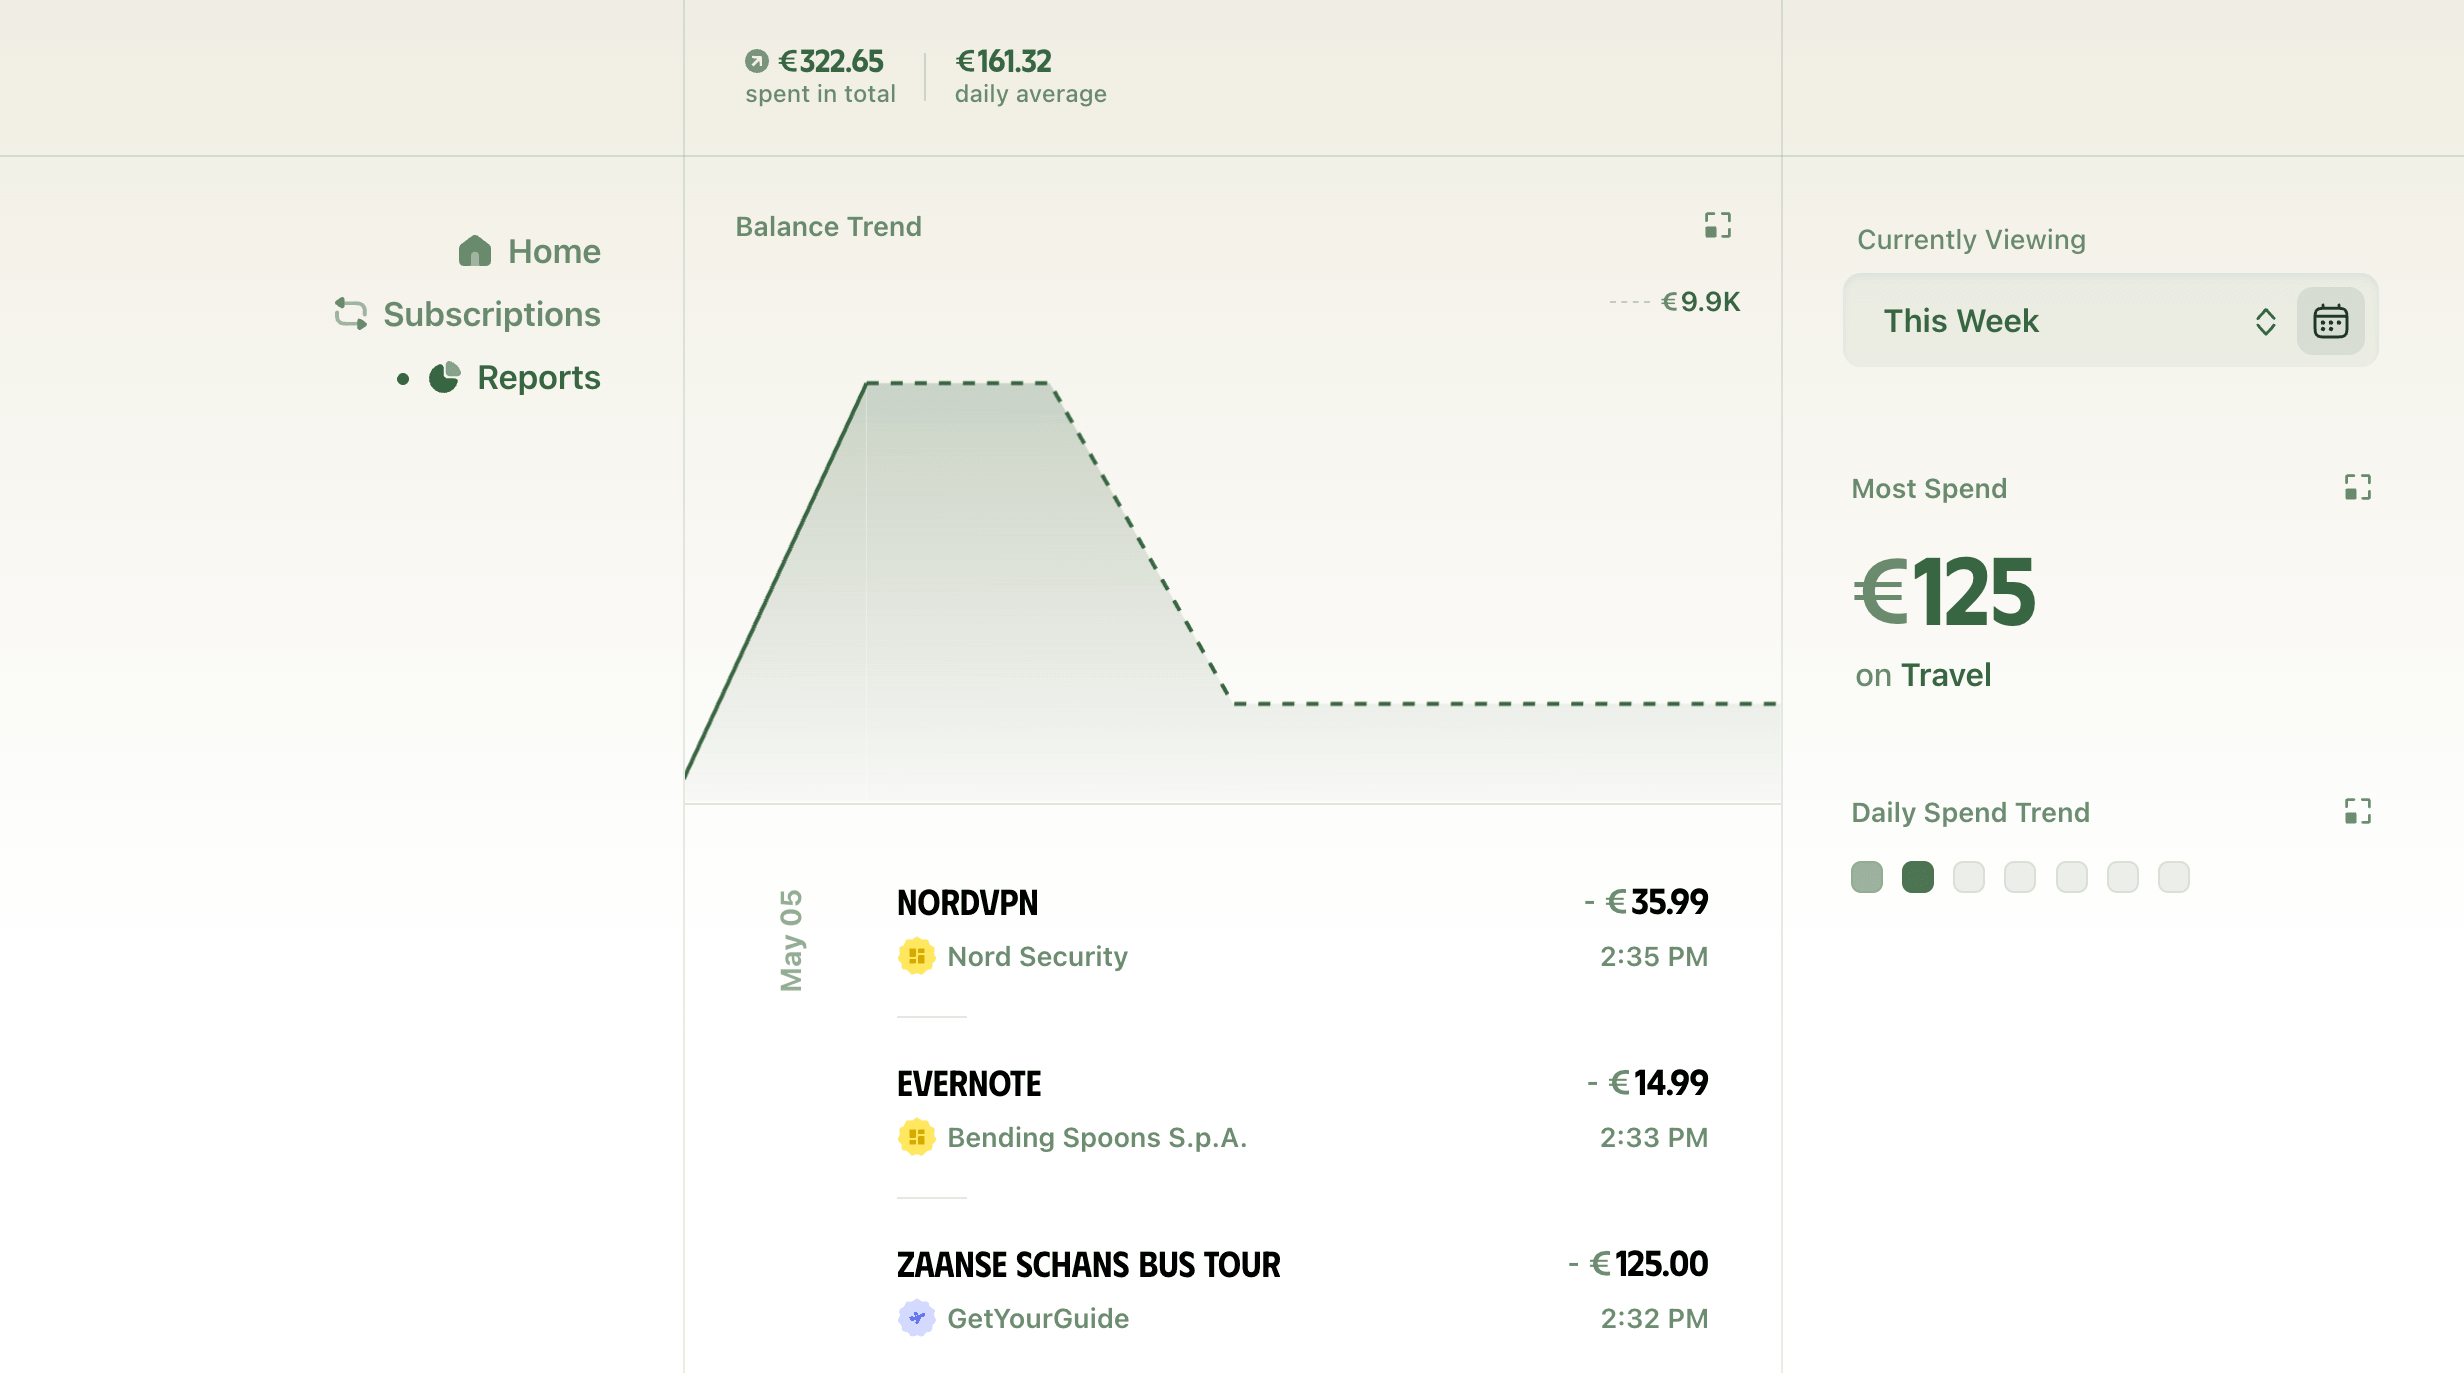
Balance and spend trends
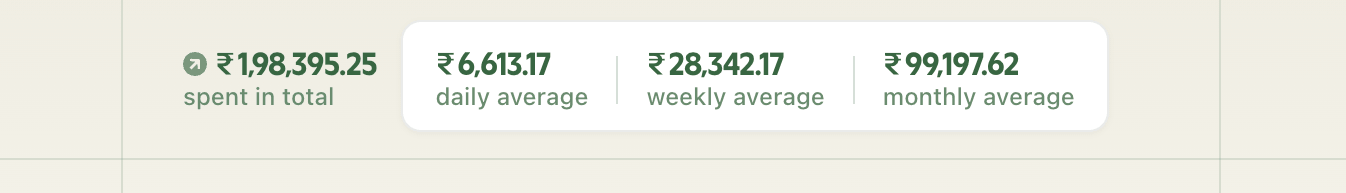
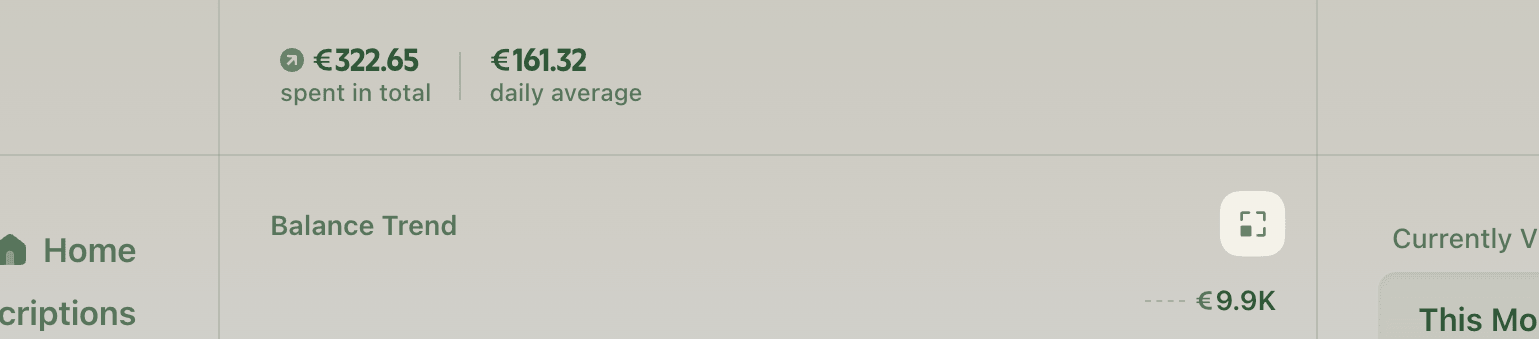
The header area on the reports page shows you the total spend during your selected time range, and the average spend across days, weeks and months.
The weekly and monthly averages are shown on hover only when the selected time range has expenses spanning more than a week or month:
The chart below the header visualises how you've spent your money over the selected period through changes in your account balance.
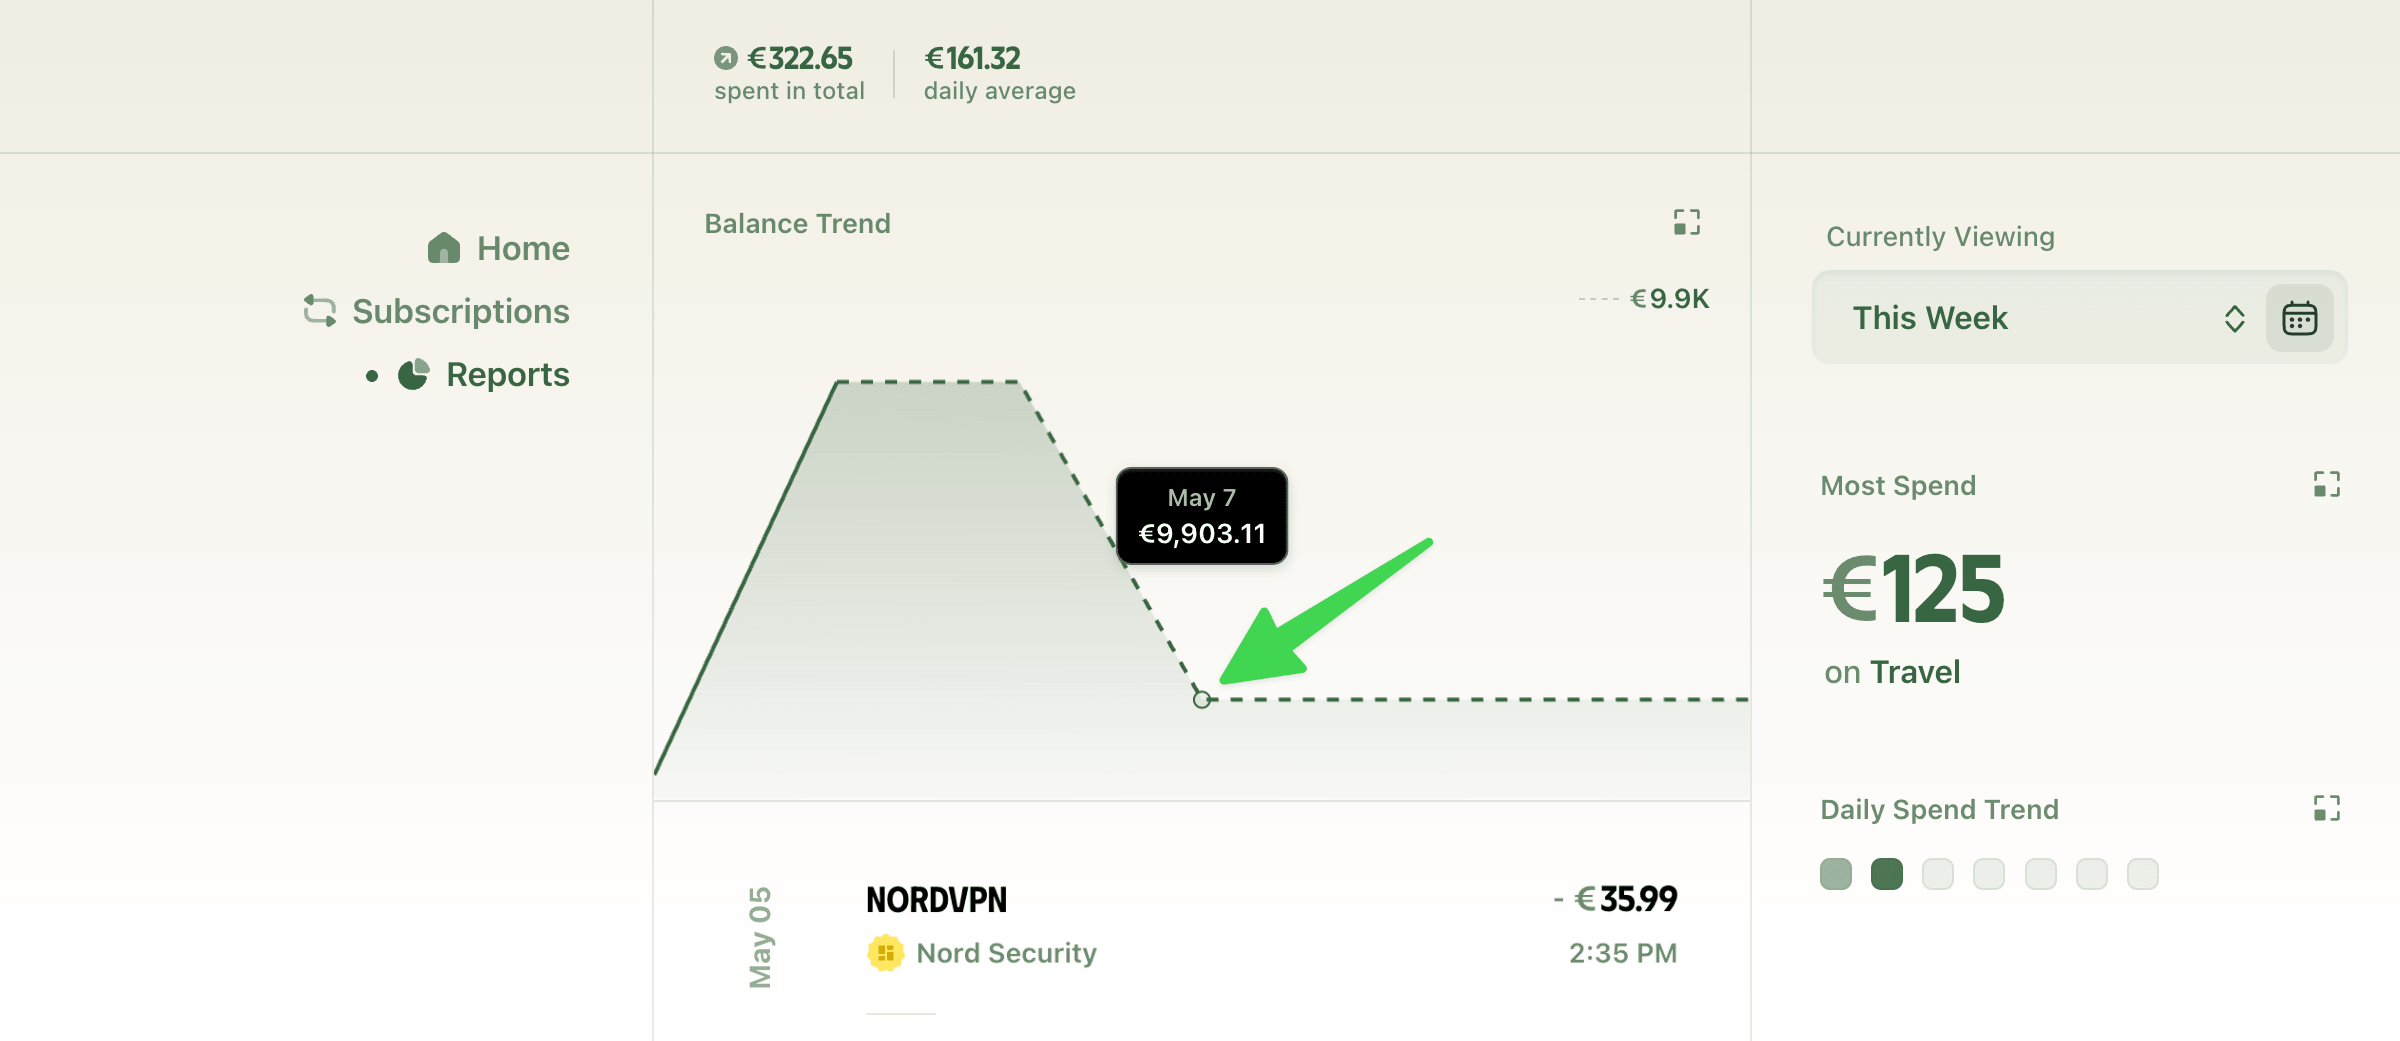
A dotted line in the balance chart represents predicted balance over future dates, which are shown when the selected time range contains future dates, such as This Week, This Month, etc.
Ducat also factors in your upcoming subscriptions when predicting a future balance.
Therefore, any dips in balance in the dotted region represent a scheduled subscription charge:
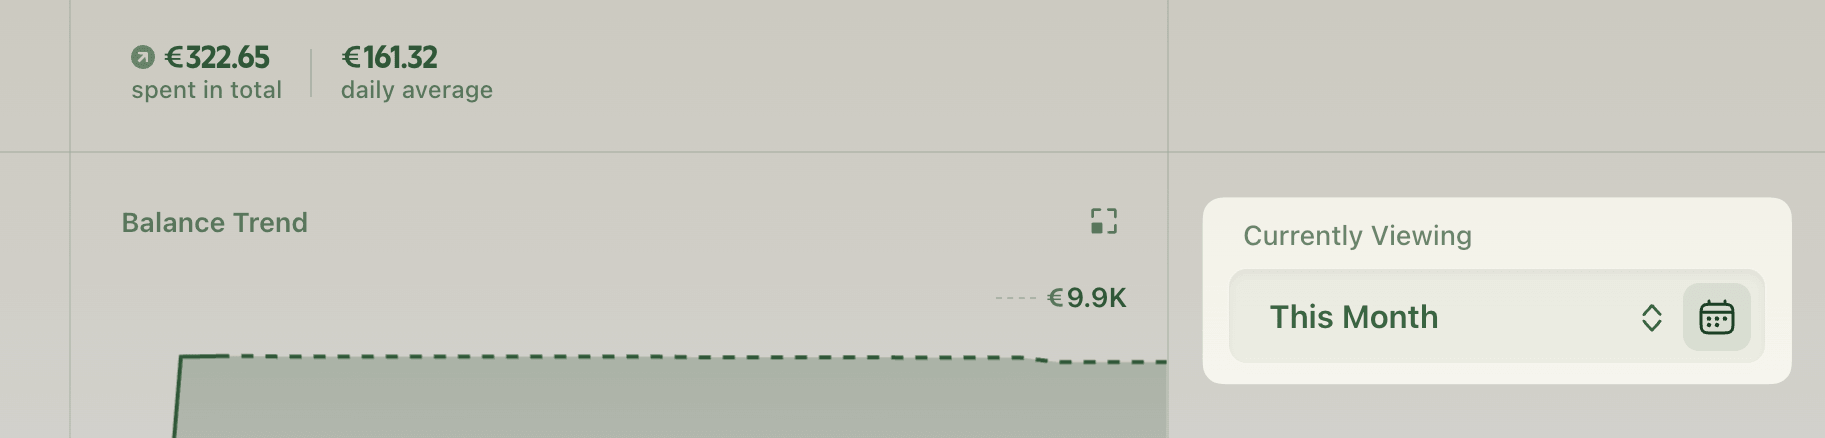
Changing the time range
By default, Ducat shows reports for the current week on the Reports page.
You can change this to any of the predefined time periods or a custom date range using the switcher:
Zooming in for more details
Whenever any section of the Reports page shows this expand icon, you can click it to view that section in greater detail:
The breakdown brief
Click the expand icon inside the balance trend section to view a detailed briefing of your expenses and income during the selected time range, which you can skim to quickly have a summary of your spending habits during the time:
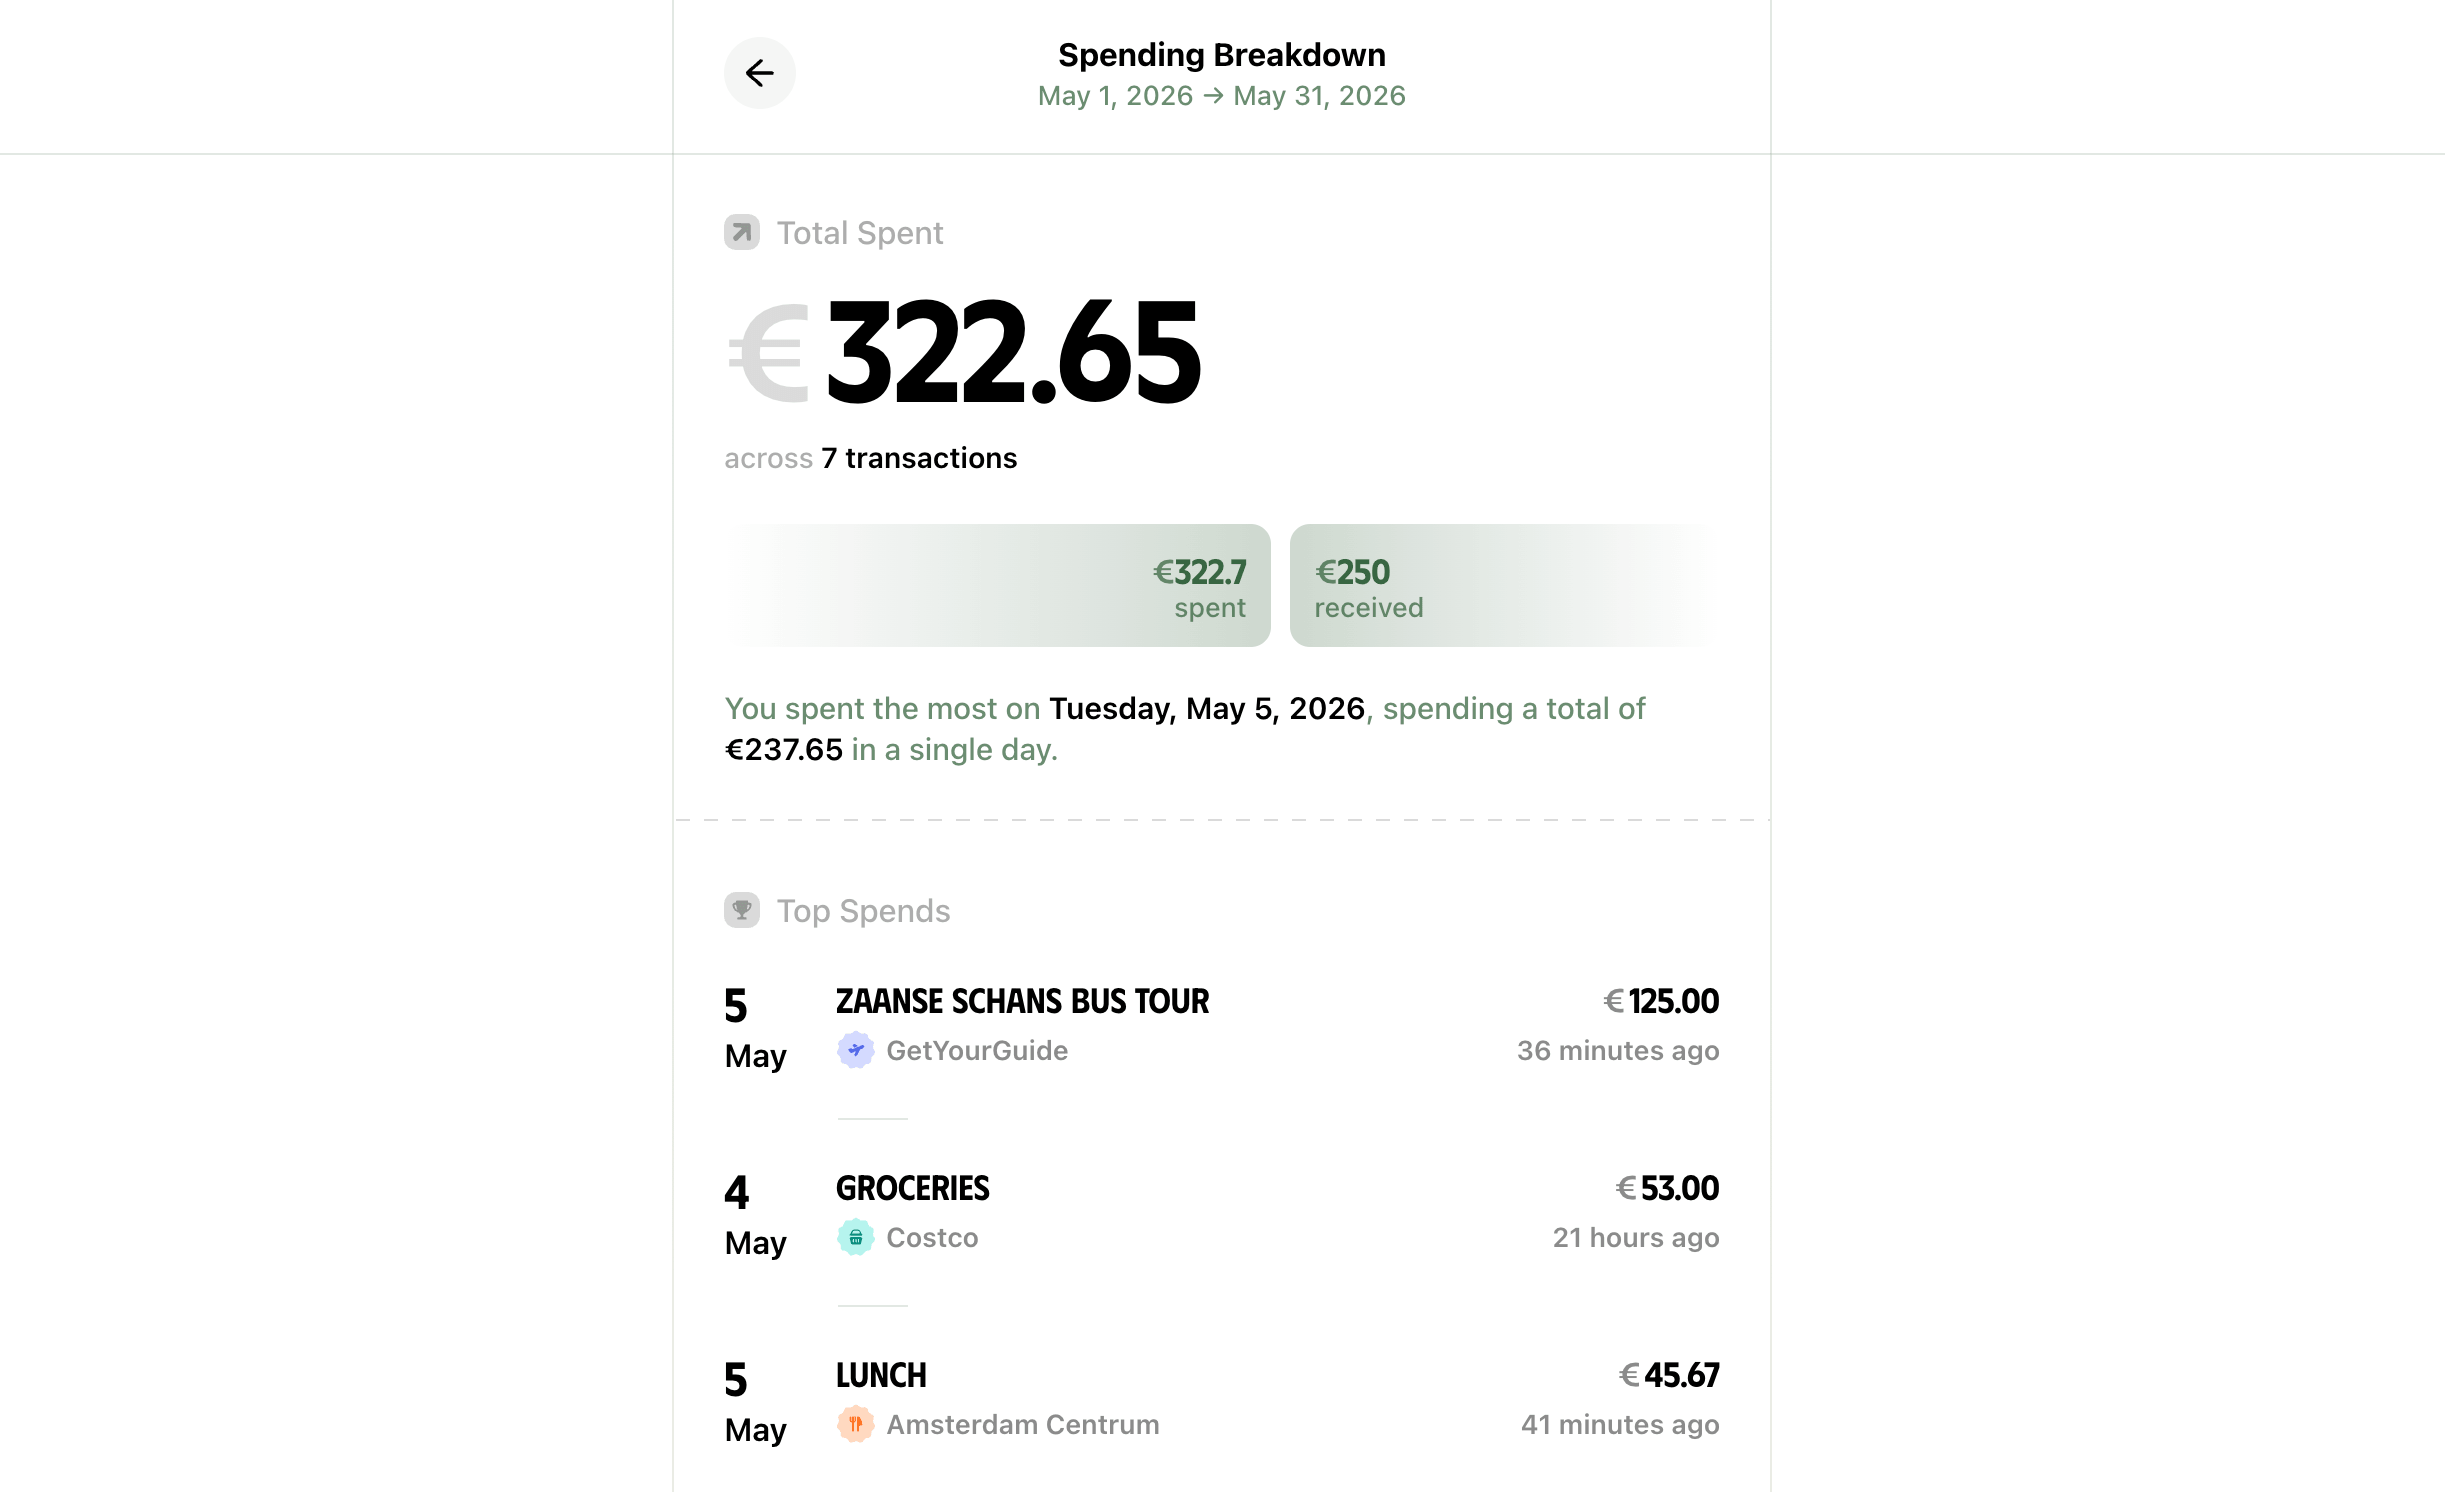
This briefing is especially helpful in evaluating your finances over a month or even a week.
You can quickly spot any expensive spends that might be an impulse buy, see if you're spending more than your income, and other fine details, such as the day you spent the most money during the selected time range.
Scroll down further to see how much of your spending during this time was due to subscriptions renewing, and how you are spending your money across a week:
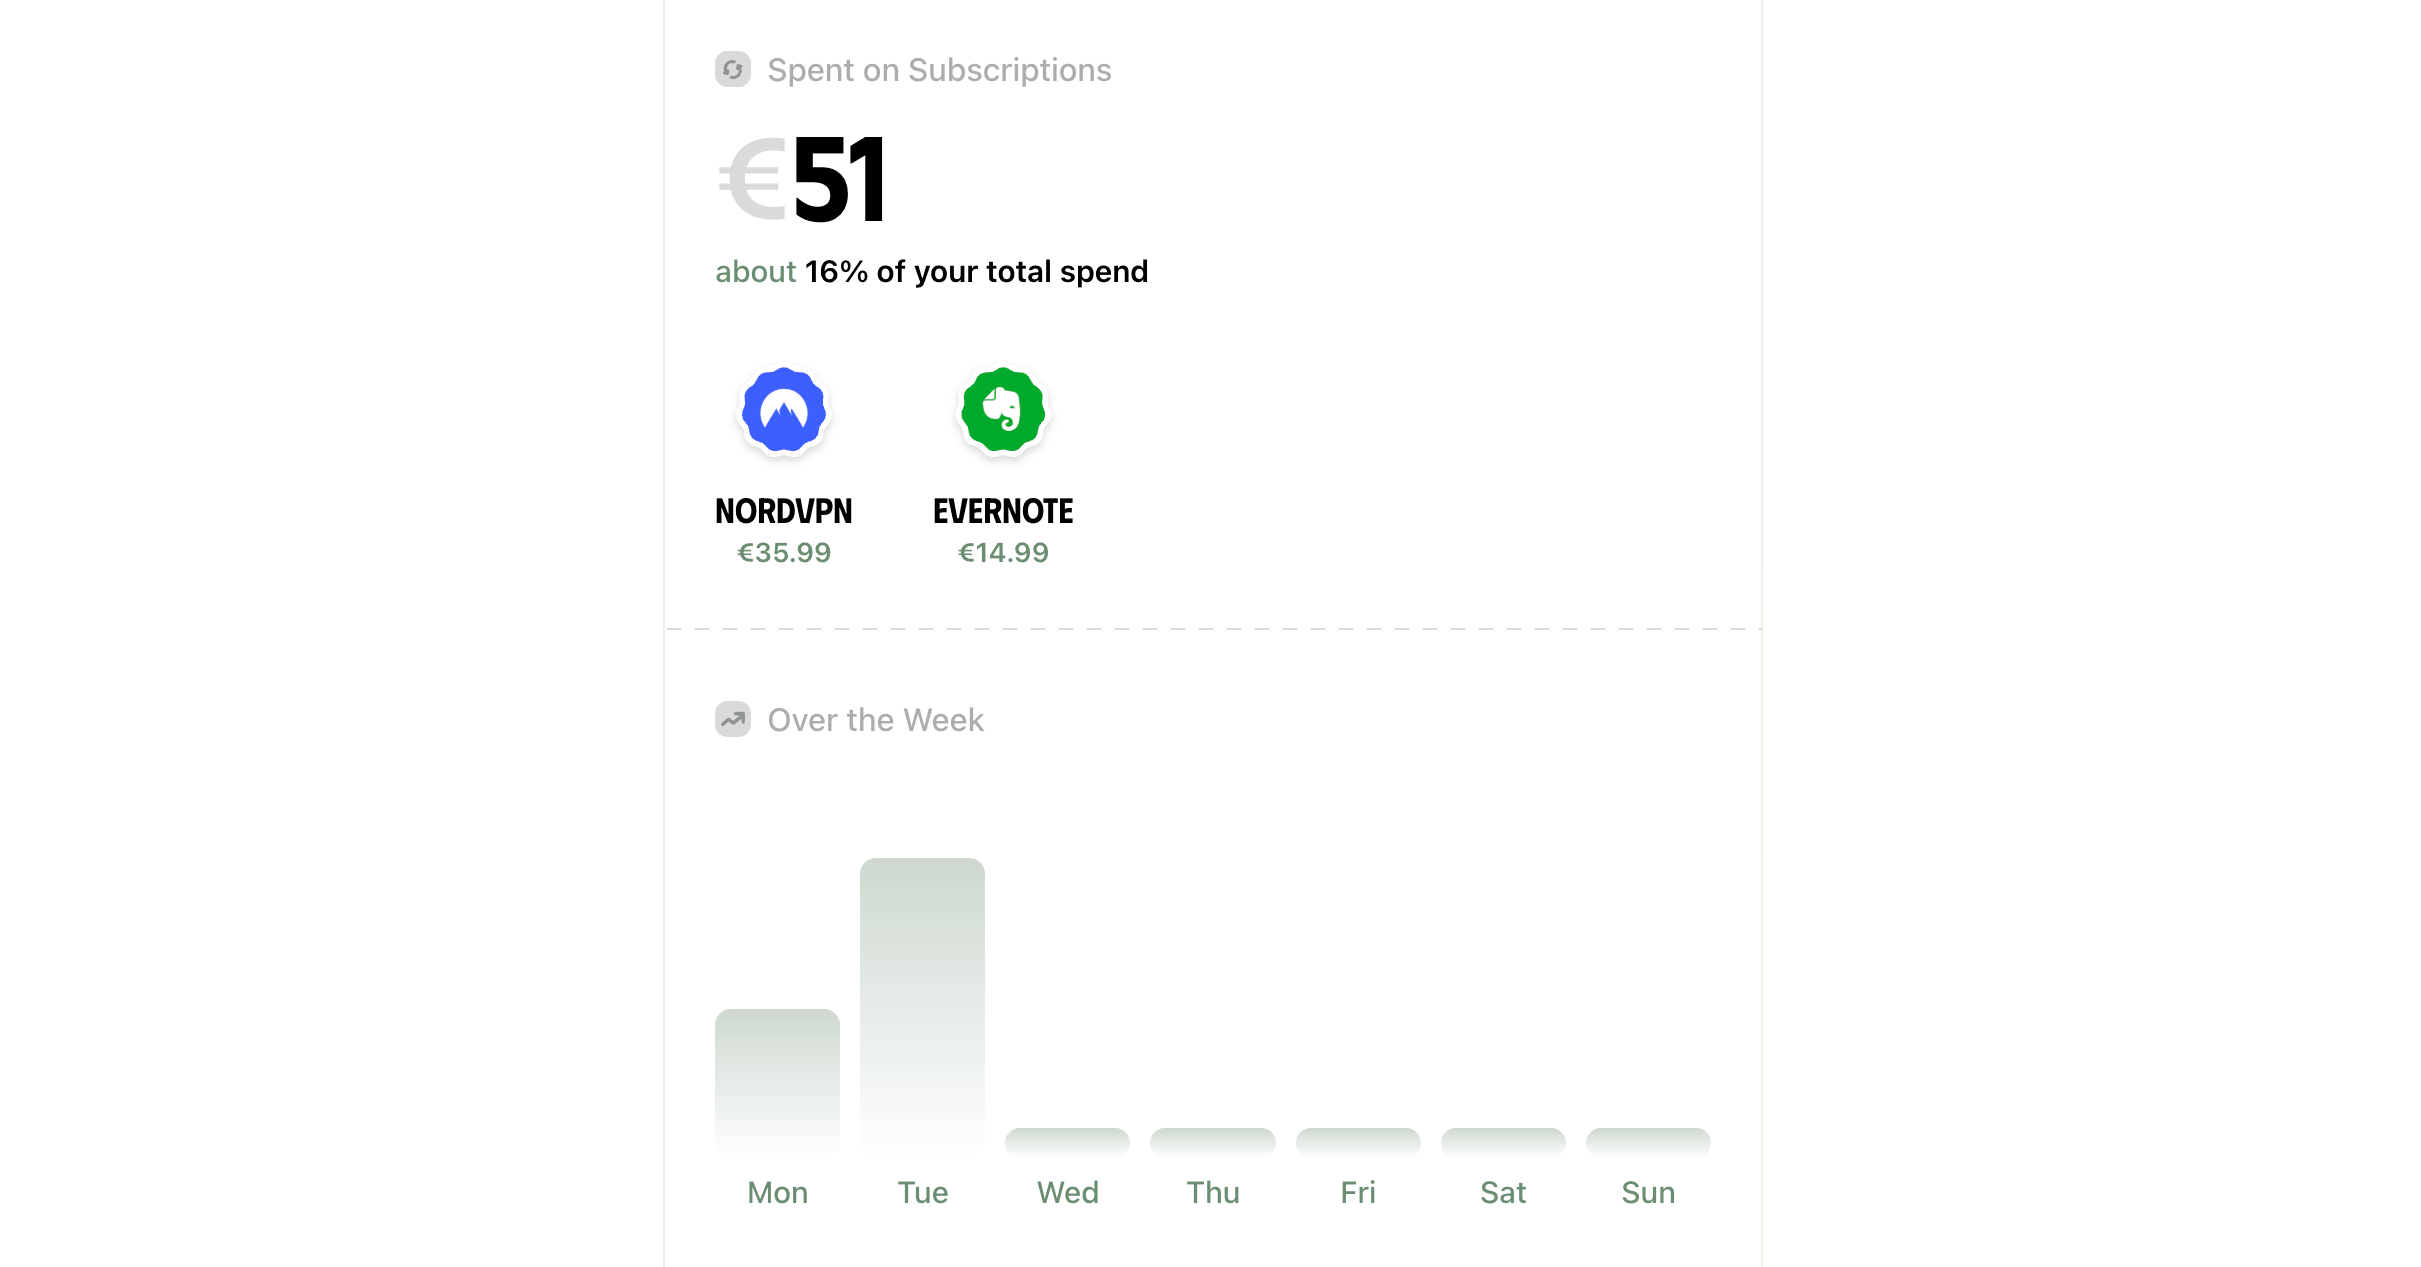
The weekday trend chart can be incredibly useful in identifying regular spending patterns.
If you've been spending heavily every Monday for a month or more, it could be an indicator that you're turning to shopping to beat the Monday blues at work.
Category-wise breakdown
Click the expand icon inside the highest spend category section on the side to see your transaction totals grouped by categories:
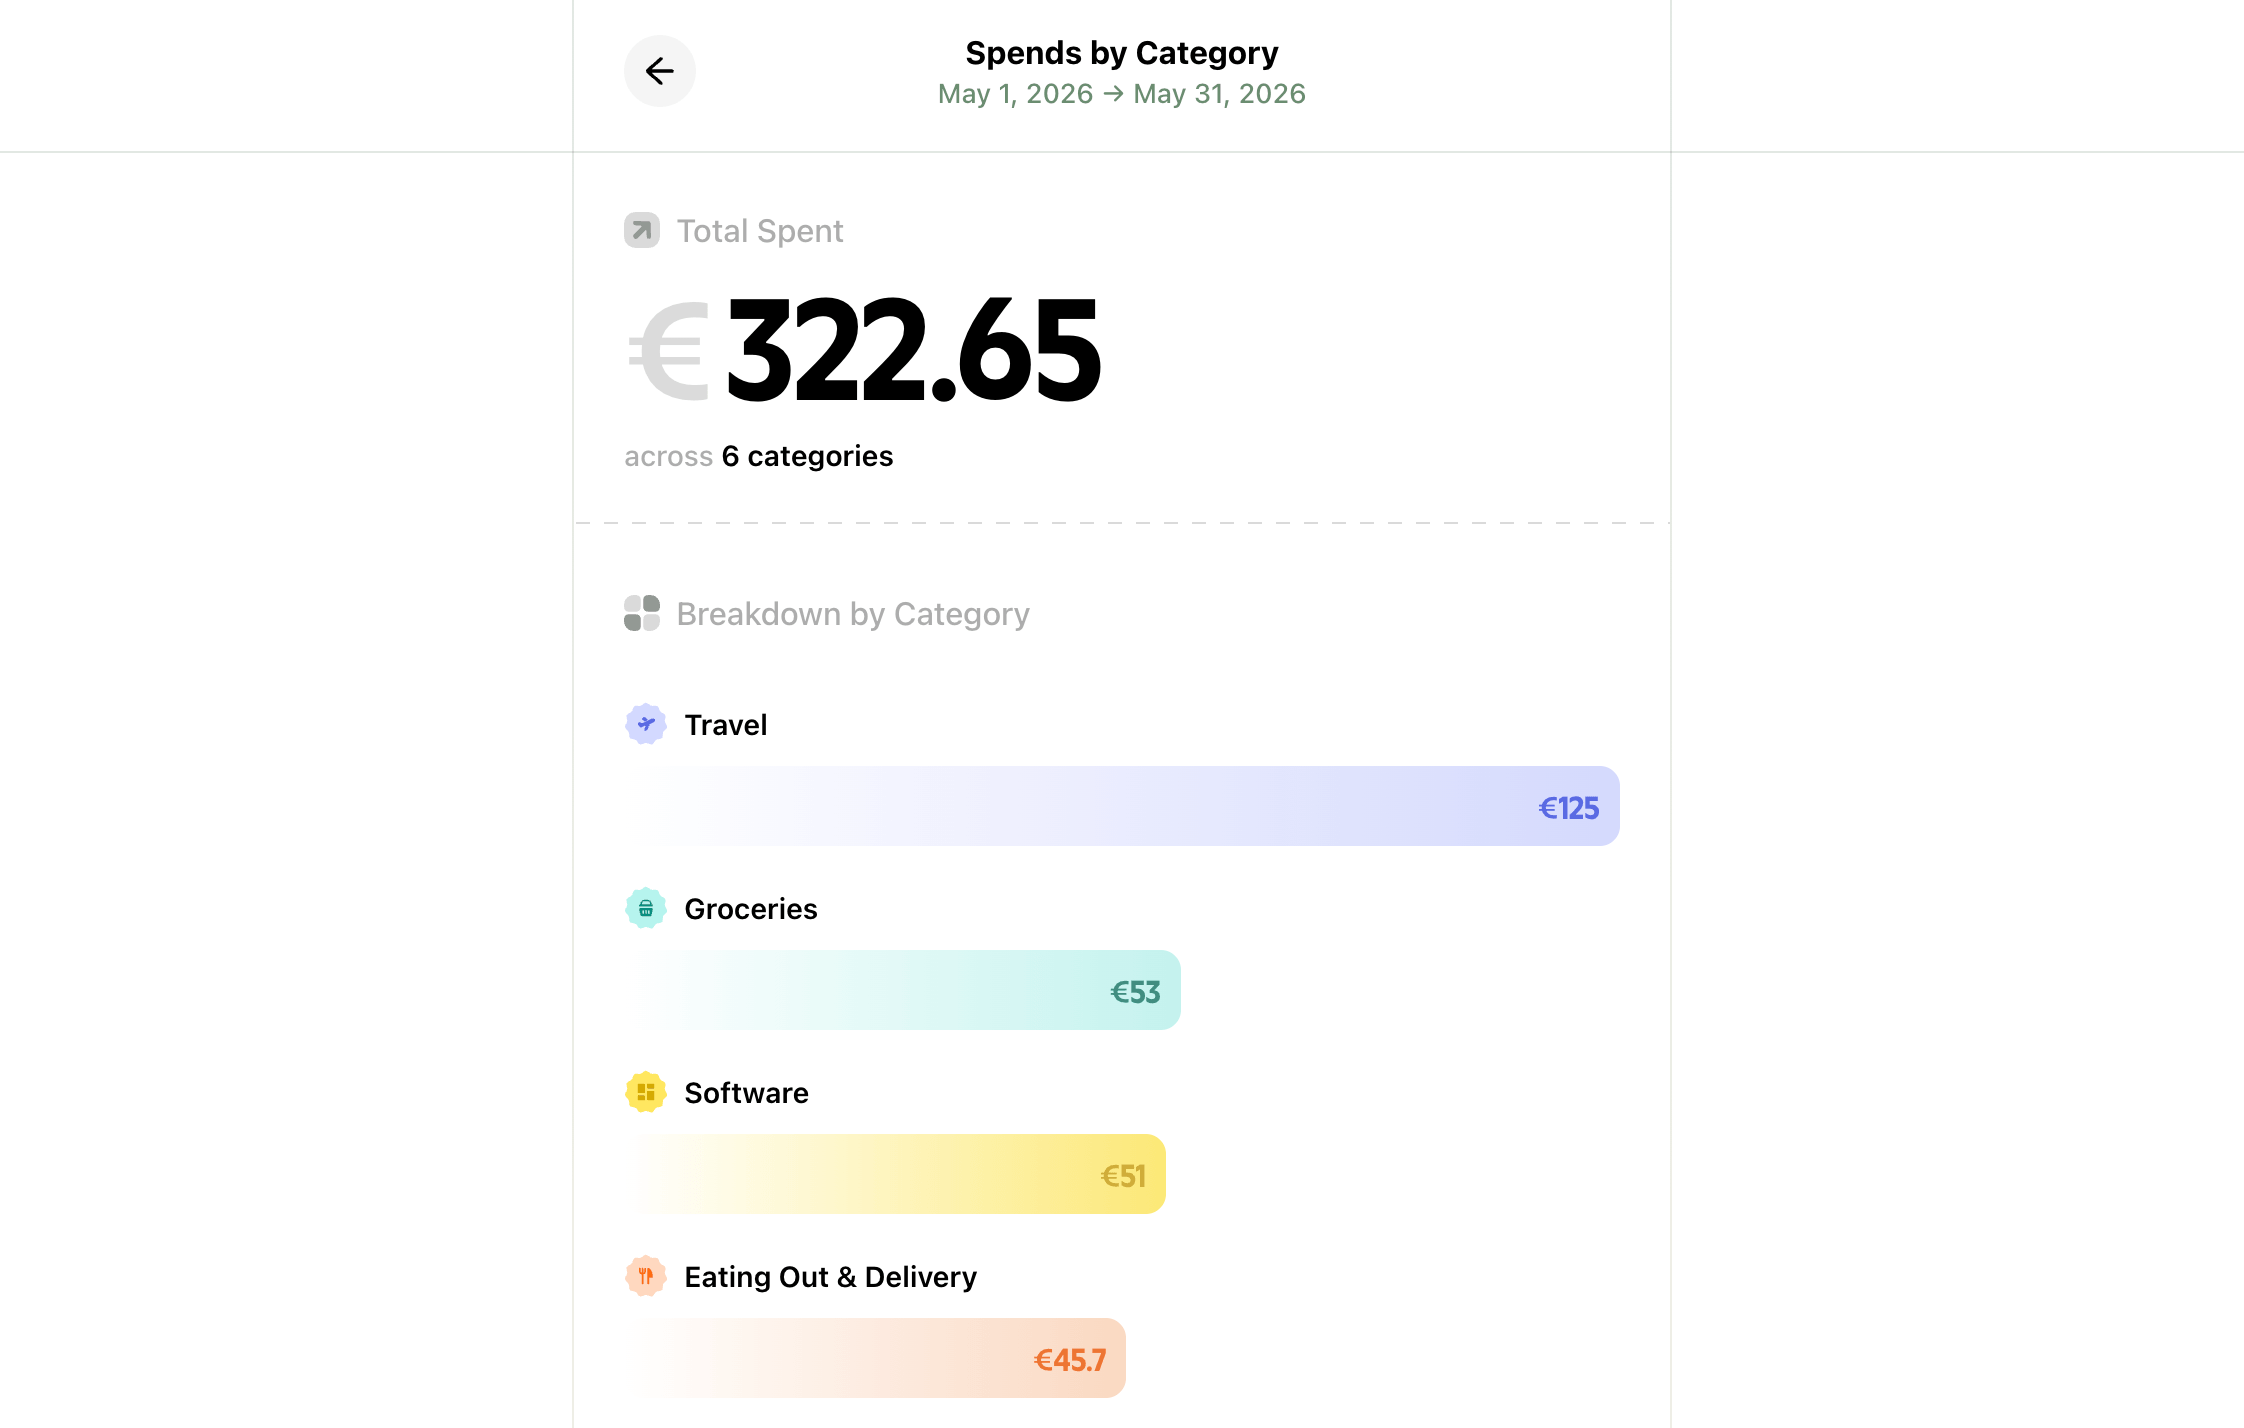
Hover over a bar to see the exact total:
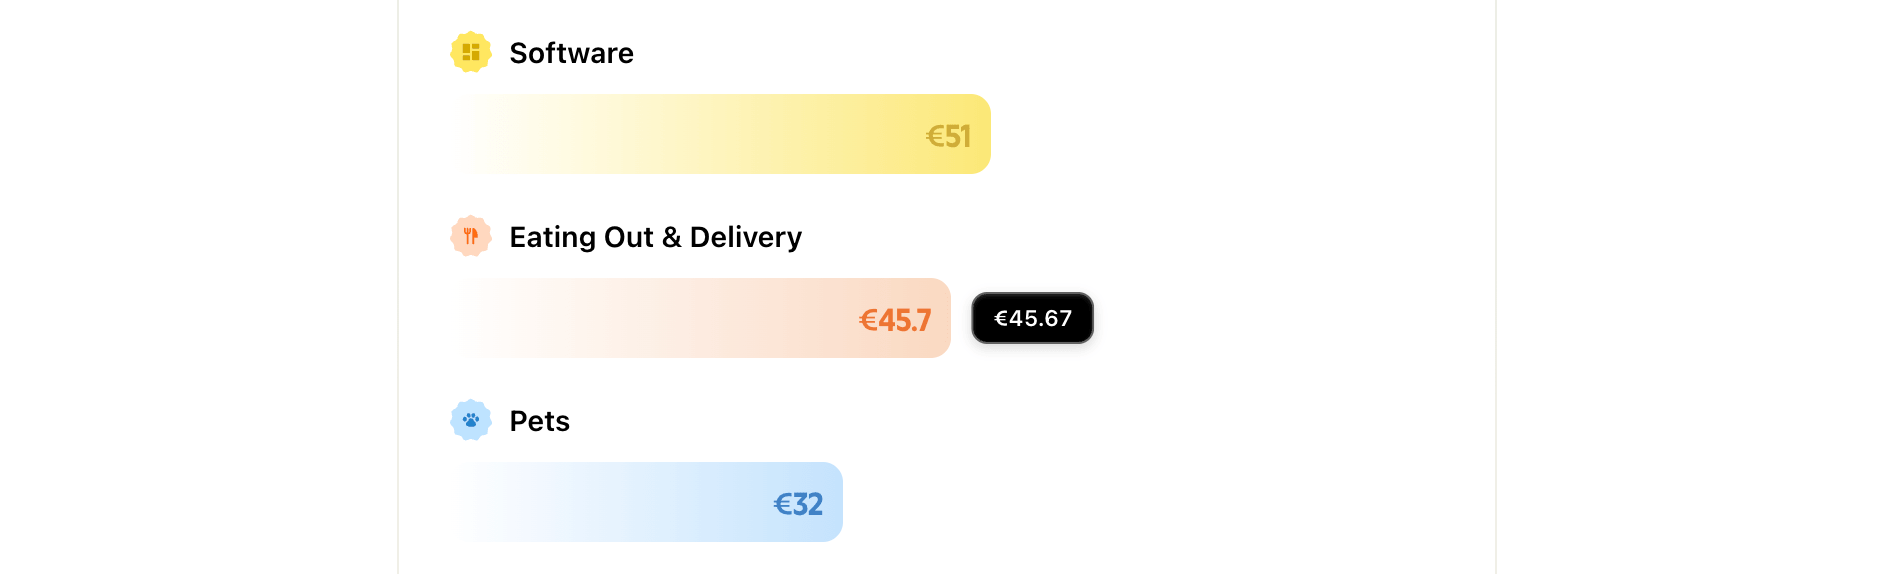
This will give you an idea of where you're spending most of your income every month or over a longer period.
Seeing daily totals on a calendar
Click the expand icon inside the daily spend trend section on the side to view your daily spend totals on a calendar:
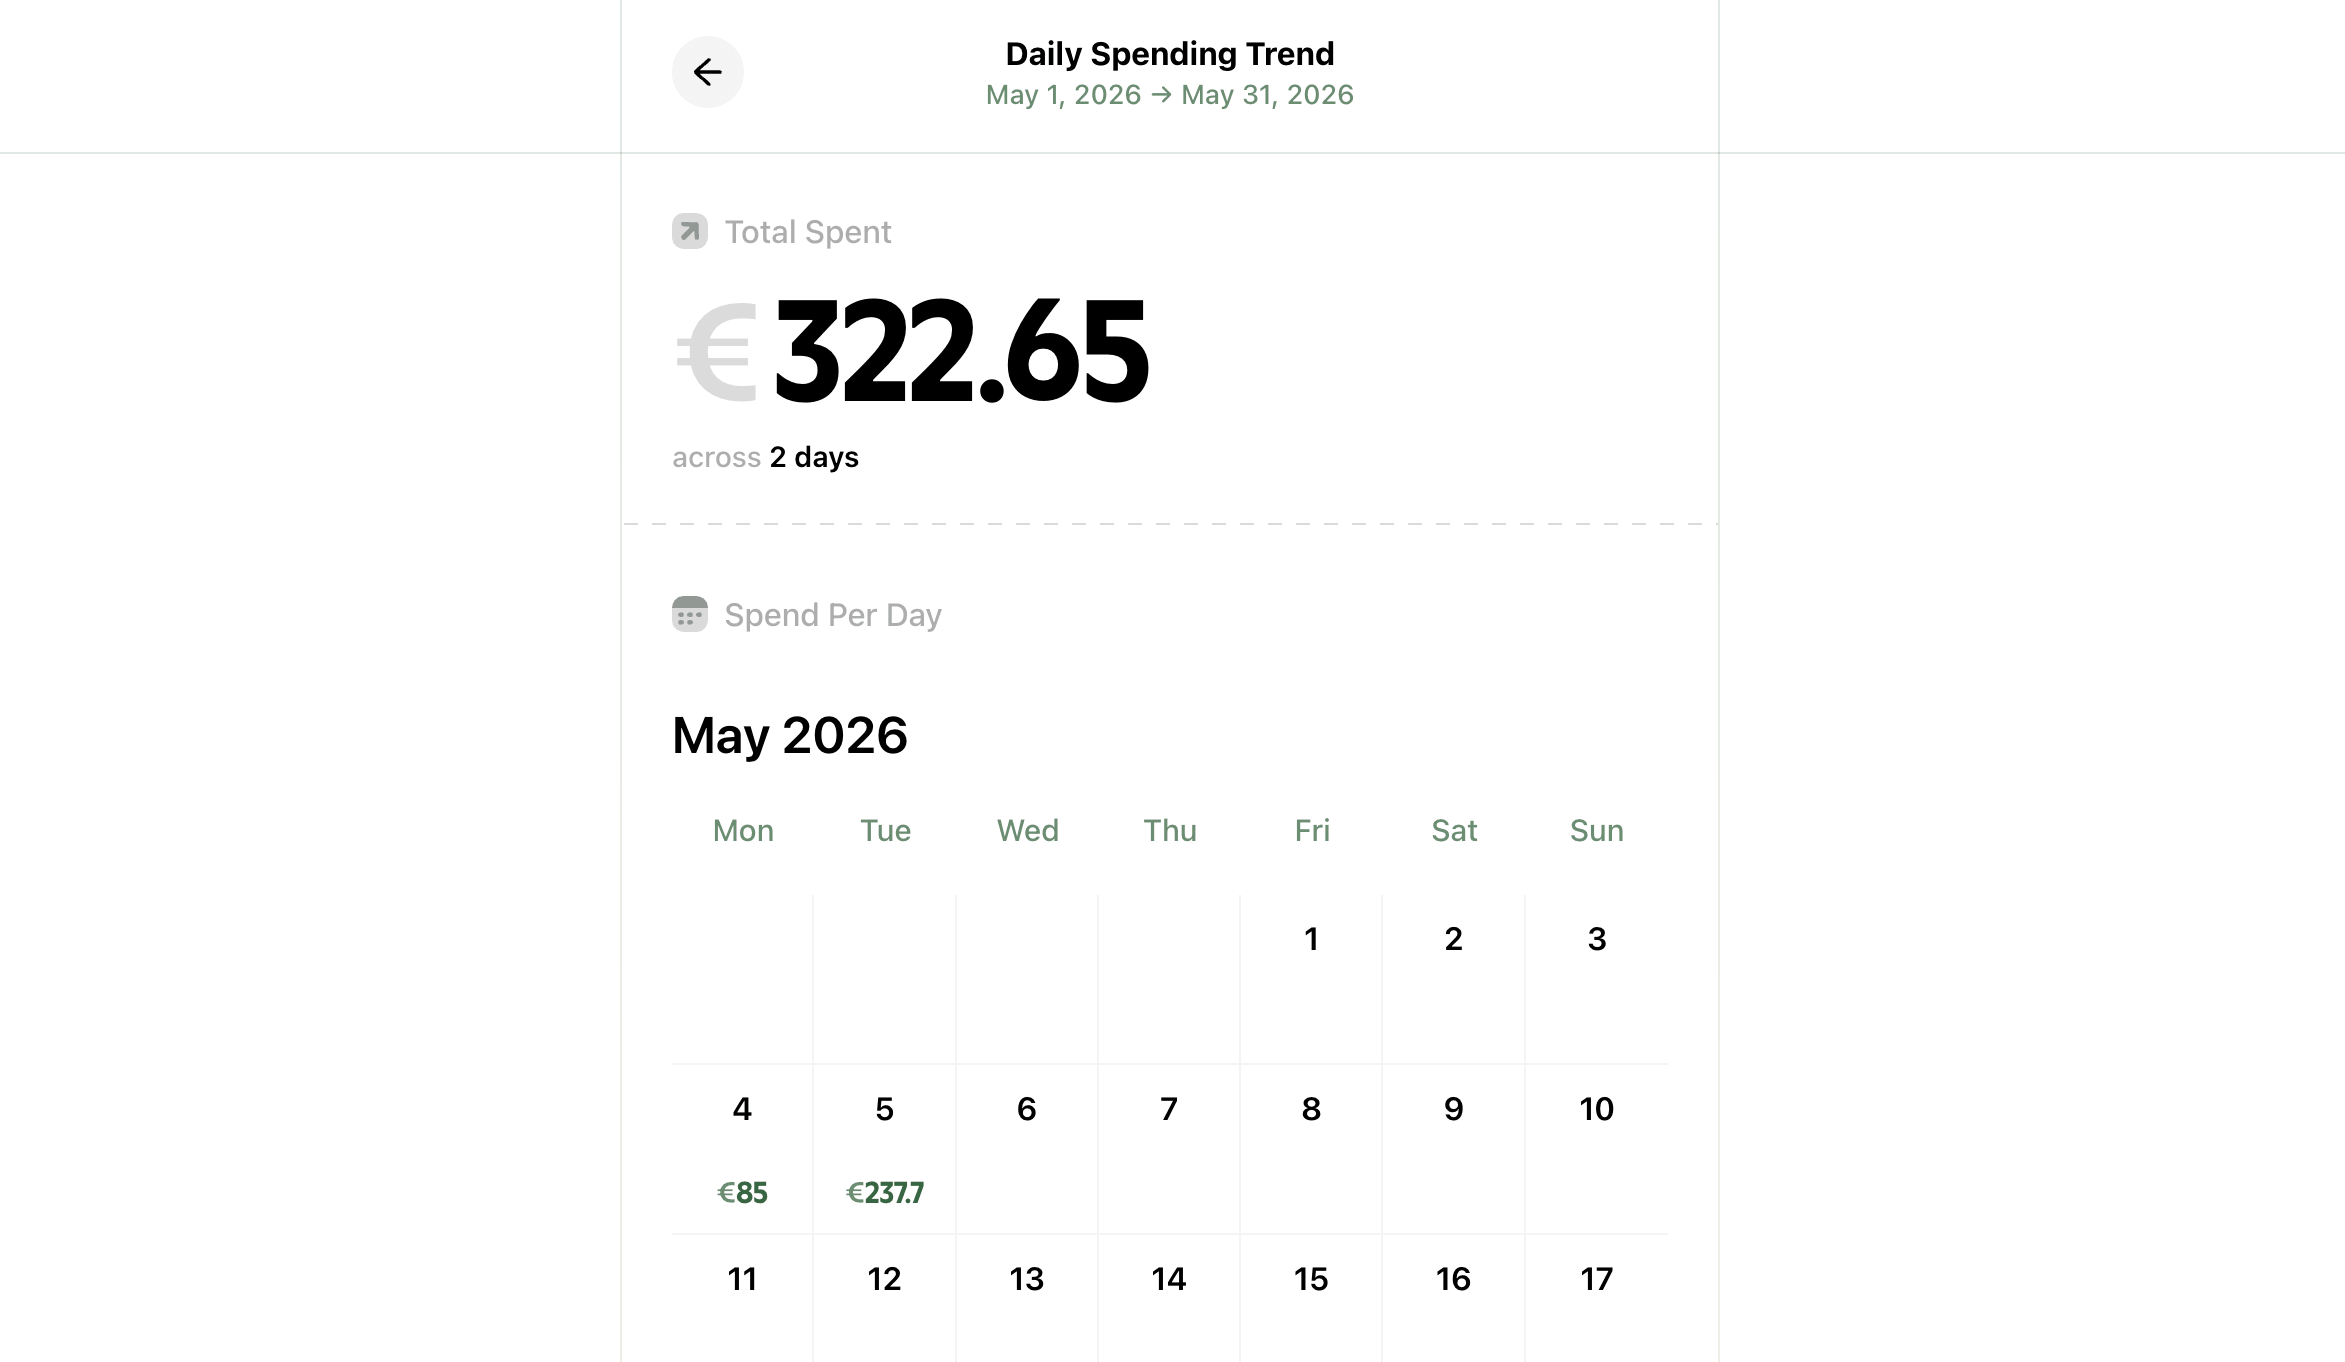
This layout gives you a bird's-eye view of how much money you're spending on average every day.
You can then use that information to decide whether to reduce your daily spending to meet your long-term financial goals, or whether you're already on the right track.
Tip: This view can also help you plan your monthly budget if you consistently see large expenses on certain days of the month.
Making the best use of reports
While an end-of-the-month retrospect will be good enough to maintain financial discipline for many people, if you're having trouble keeping your spending in check, review your spending every week.
At the start of each week, go to Reports → Last Week and review your spending through the various reporting tools in the app.
This will help you understand any room for improvement and correct your course early.
Need more help?
Email your question or issue and we’ll get back to you shortly.
Send an email